Posts

Showing posts from August, 2017

A (UK) Pensions Data Format Standard - let's make it happen! (Part 2)
Image
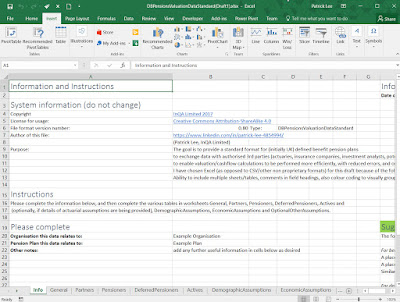
(This is a follow up to part 1 which you can see here .  Posted by  Patrick Lee   on 15 August 2017). Proposed First Draft I've now completed a first draft of a proposed standard, as a Microsoft Excel file (118kB, so quite small). You can download it here . Comments/criticisms most welcome. Let's make this happen! Why Microsoft Excel? I've chosen to put it in an Excel file (as opposed to CSV or other non proprietary formats) for the moment because Excel offers the following advantages: we can put several different worksheets/tables in a single file field headings can have explanatory comments I've using colour coding to visually group similar fields. The goal The goal is to provide a standard format for (initially UK) defined benefit pension plans to exchange data with authorised 3rd parties (actuaries, insurance companies, investment analysts, potential purchasers etc) to enable valuation/cashflow calculations to be performed more efficiently, with r...

Moving pensions and insurance towards Web 3.0

Image
I've just watched several videos and read a good article on the Semantic Web (also called Linked Data and Web 3.0, in which not just humans but computers can understand content) by Brian Sletten . It would be good for the pensions and insurance industry to play its part in helping the web move towards 3.0 (something that will have even more of an impact than Web 1.0 did in about 1998, and Web 2.0 - the advent of social media which enabled everyone to connect and become a publisher - in about 2008) and I will be writing more about this soon. Click the image below to go to an interactive map of several existing linked data sets (across a wide range of disciplines, including life sciences, geography, publications, government data). (Posted by Patrick Lee on 14 August 2017).

Useful charts for business/data analysis in Excel 2016

Image
You may not know that Excel 2016 added some useful new charts for analysing data.  I particularly like the Treemap, Box & Whisker and Pareto charts.  (The images below are taken from this Microsoft post , please see that link for more detail on these and other charts). The Treemap gives you a quick view of which categories are most significant:  

A (UK) Pensions Data Format Standard - let's make it happen!

Image
I have long thought it would be useful for there to be a standard format for exchange of data files for DB (Defined Benefit, i.e. final salary or career average revalued) pension plans, at least in the UK initially. This would make it easier for pension plans to share information (with actuarial consultants, but also other advisers e.g. buyout companies, investment analysts), not just in mergers and acquisitions, but also in risk transfers (longevity, or pensions buyouts) and would improve the comparability of analysis across companies by investors etc.  It should also reduce costs for trustees and plan sponsors, and may increase the quality of the data held. I think this both with my InQA hat on (I declare an interest in that our pensionsconcerto.com product would be well placed to use such a standard), but also from the point of view of being an improvement for the pensions industry generally.  Investment banks have standard formats for exchange of information abo...

How corporate pension liabilities could vary by 10% or more, even on an agreed set of assumptions

Image
Why is there a range of answers, even using a given set of assumptions? Are these differences real, or artificial? (Blog post by Patrick Lee) It would clearly make a difference whether a company's pension liabilities were £475m, £500m or £525m ...  The value of an organisation's defined benefit (final salary or CARE - career average revalued) pension plan promises normally depends on many uncertainties, including: how long the plan members and their partners are expected to live what proportions of active members will leave service, or retire on ill health, before reaching normal retirement age what the future rates of salary growth and price inflation (and hence pension increases) will be assuming that a perfectly matching asset portfolio can't be found (normally such a portfolio doesn't exist), then what the future rates of reinvestment (for cashflow mismatches) will be. Defining the liabilities uniquely and making all assumptions explicit Bu...